所述配对双样品的Wilcoxon检验一种的非参数检验,其可以被用于比较样品的两个独立数据。
本文介绍如何在ř中计算两个样本的秩检验。
可视化数据并在ř中计算的Wilcoxon测试
ř函数用于计算的秩检验
为了执行两个样本的Wilcoxon检验,比较两个独立样本(x&y)的均值,R函数wilcox.test()可以如下使用:
wilcox.test(x, y, alternative = "two.sided")
- x,y:数字向量
- 替代方案:替代假设允许值是“two.sided”(默认值),“更大”或“更少”之一。
将数据导入R.
-
准备数据
-
将数据保存在外部的.TXT选项卡或的的.csv文件中
-
将您的数据导入ř如下:
- # If .txt tab file, use this
- my_data <- read.delim(file.choose())
- # Or, if .csv file, use this
- my_data <- read.csv(file.choose())
在这里,我们将使用一个示例数据集,其中包含18个人(9名女性和9名男性)的权重:
- # Data in two numeric vectors
- women_weight <- c(38.9, 61.2, 73.3, 21.8, 63.4, 64.6, 48.4, 48.8, 48.5)
- men_weight <- c(67.8, 60, 63.4, 76, 89.4, 73.3, 67.3, 61.3, 62.4)
- # Create a data frame
- my_data <- data.frame(
- group = rep( c("Woman", "Man"), each = 9),
- weight = c(women_weight, men_weight)
- )
我们想知道,如果女性体重的中位数与男性体重的中位数不同?
检查数据
print(my_data)
- group weight
- 1 Woman 38.9
- 2 Woman 61.2
- 3 Woman 73.3
- 4 Woman 21.8
- 5 Woman 63.4
- 6 Woman 64.6
- 7 Woman 48.4
- 8 Woman 48.8
- 9 Woman 48.5
- 10 Man 67.8
- 11 Man 60.0
- 12 Man 63.4
- 13 Man 76.0
- 14 Man 89.4
- 15 Man 73.3
- 16 Man 67.3
- 17 Man 61.3
- 18 Man 62.4
可以按组计算(中位数和四分位数间距(IQR))。可以使用dplyr包。
- 要安装dplyr软件包,请键入以下内容:
install.packages("dplyr") - 按组计算摘要统计信息:
- library(dplyr)
- group_by(my_data, group) %>%
- summarise(
- count = n(),
- median = median(weight, na.rm = TRUE),
- IQR = IQR(weight, na.rm = TRUE)
- )
- Source: local data frame [2 x 4]
- group count median IQR
- ( fctr) (int) (dbl) (dbl)
- 1 Man 9 67.3 10.9
- 2 Woman 9 48.8 15.0
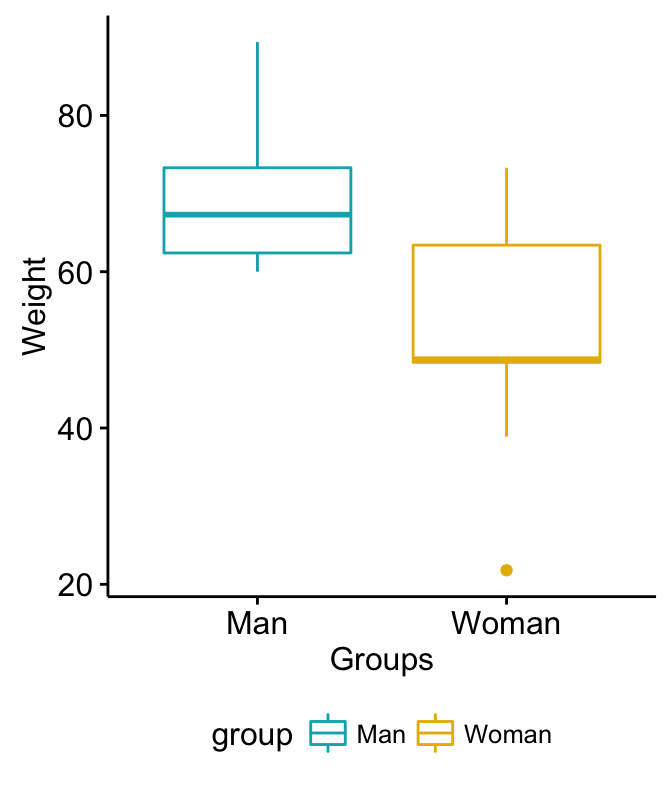
使用箱形图可视化数据
您可以按照此链接中的描述绘制R基本图:。在这里,我们将使用进行基于ggplot2的简单数据可视化
- 从GitHub上的安装最新版本的ggpubr如下(推荐):
- # Install
- if(!require(devtools)) install.packages("devtools")
- devtools::install_github( "kassambara/ggpubr")
- 或者,从CRAN安装如下:
install.packages("ggpubr") - 可视化您的数据:
- # Plot weight by group and color by group
- library( "ggpubr")
- ggboxplot(my_data, x = "group", y = "weight",
- color = "group", palette = c("#00AFBB", "#E7B800"),
- ylab = "Weight", xlab = "Groups")

计算不成对的双样本秩检验
问题:女性和男性体重有显着差异吗?
1)计算双样本Wilcoxon检验 - 方法1:数据保存在两个不同的数值向量中。
res <- wilcox.test(women_weight, men_weight)res
-
- Wilcoxon rank sum test with continuity correction
- data: women_weight and men_weight
- W = 15, p-value = 0.02712
- alternative hypothesis: true location shift is not equal to 0
它将发出一条警告信息,称为“无法用平局计算精确的p值”。它可以通过添加另一个参数exact = FALSE来抑制此消息,但结果将是相同的。
2)计算双样本Wilcoxon检验 - 方法2:将数据保存在数据框中。
res <- wilcox.test(weight ~ group, data = my_data, exact = FALSE)res
-
- Wilcoxon rank sum test with continuity correction
- data: weight by group
- W = 66, p-value = 0.02712
- alternative hypothesis: true location shift is not equal to 0
# Print the p-value onlyres$p.value
[1] 0.02711657
如您所见,这两种方法给出了相同的结果。
测试的p值为 0.02712,小于显着性水平α= 0.05。我们可以得出结论,男性的中位数体重与女性的中位数体重显着不同,p值 = 0.02712。
注意:
- 如果你想测试男性体重的中位数是否小于女性体重的中位数,请输入:
wilcox.test(weight ~ group, data = my_data, exact = FALSE, alternative = "less")
- 或者,如果您想测试男性体重的中位数是否大于女性体重的中位数,请输入此值
wilcox.test(weight ~ group, data = my_data, exact = FALSE, alternative = "greater")